Risk dashboards are giving institutions a unified command center to monitor stablecoin holdings, exposures, and systemic vulnerabilities in real time.
Introduction
Stablecoins have matured into the foundation of digital liquidity. For traders, they are convenient instruments. For institutions, they are strategic assets. But with scale comes responsibility. Billions in capital must be managed with precision, ensuring that risks are identified before they materialize.
Institutional risk dashboards meet this challenge. By consolidating multiple streams of analytics into a single interface, they allow portfolio managers, compliance officers, and executives to oversee stablecoin exposure with clarity. In 2025, these dashboards are no longer optional. They are becoming the backbone of risk governance in digital finance.
Why Institutions Need Risk Dashboards
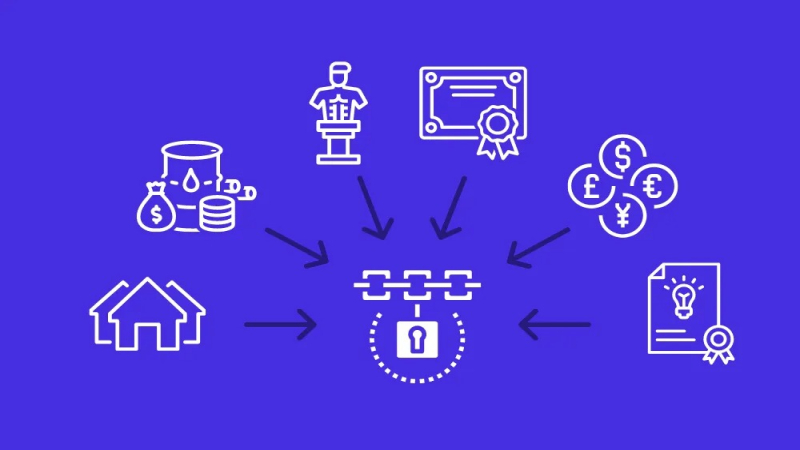
Traditional financial institutions rely on risk management frameworks to monitor credit, market, and liquidity exposures. Stablecoins introduce new dimensions of risk: on-chain concentration, cross-chain migration, peg stability, and regulatory alignment.
Without a dashboard, these risks remain fragmented. Institutions may see one part of the picture but miss the whole. Risk dashboards solve this by integrating data from multiple sources and presenting it in real time.
The result is not just oversight but foresight the ability to anticipate stress before it escalates.
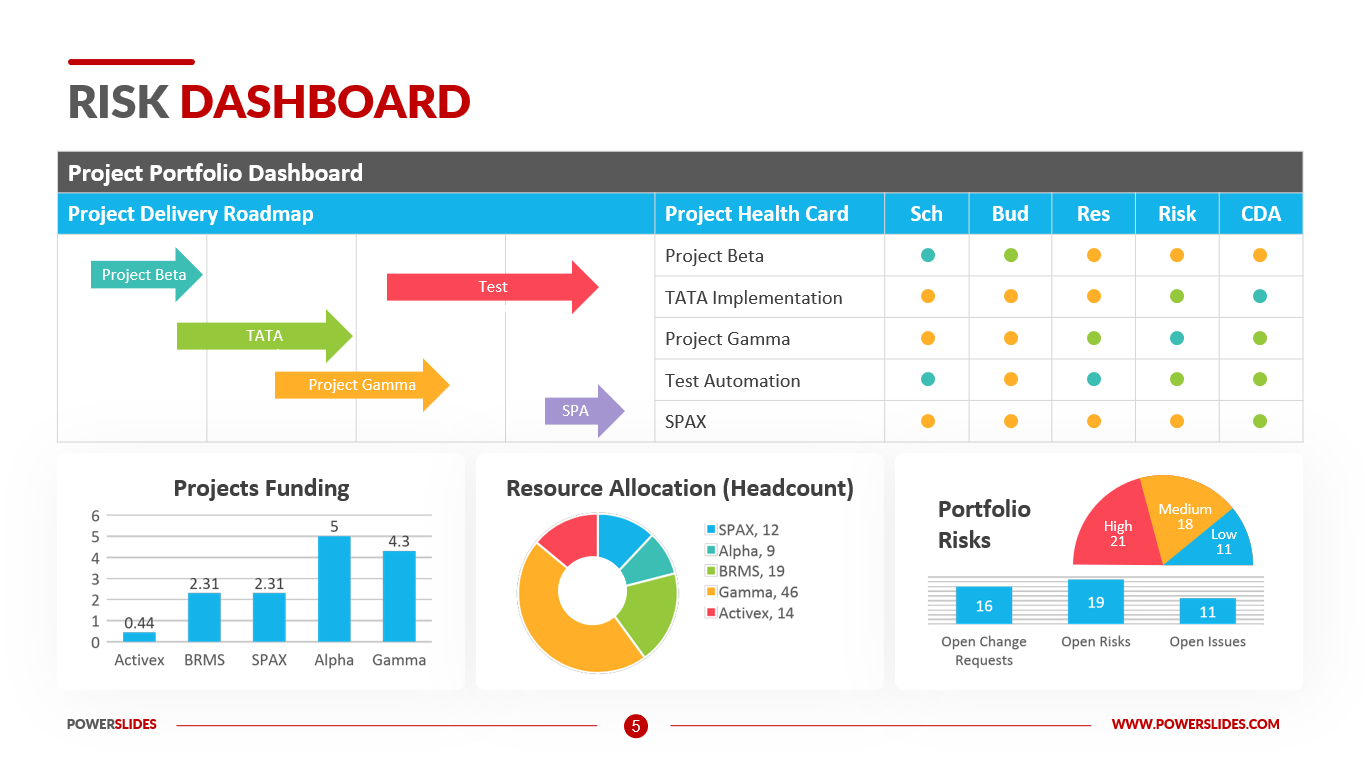
Core Features of Risk Dashboards
Institutional-grade dashboards provide a wide range of capabilities, including:
Exposure mapping across tokens, chains, and protocols.
Concentration alerts highlighting when whales dominate liquidity.
Peg stability monitoring with instant deviation flags.
Liquidity stress simulations testing portfolio resilience.
Regulatory compliance overlays that track transaction risks.
By combining these features, dashboards become more than monitoring tools. They are operational centers of risk governance.
Concentration and Whale Risk
Wallet concentration remains one of the greatest risks in stablecoin markets. Dashboards highlight the share of supply held by the top wallets, flagging whether liquidity is overly dependent on a few actors.
Institutions use this data to adjust exposures. For example, if a stablecoin portfolio shows high correlation with a small number of whales, risk managers may diversify holdings to reduce vulnerability.
This level of granularity is essential in preventing systemic shocks triggered by sudden whale transfers.
Cross-Chain Risk Monitoring
Stablecoin markets are inherently multi-chain. Ethereum provides depth, Solana offers speed, BSC captures retail, and Layer-2 networks attract cost-conscious flows.
Risk dashboards map exposure across these ecosystems. If too much liquidity is tied to a single chain, the institution faces potential disruption from congestion, hacks, or regulatory restrictions. Dashboards highlight these imbalances, ensuring managers maintain healthy diversification.
Peg Stability Oversight
Stablecoin credibility depends on the peg. Even minor deviations erode trust if they persist. Risk dashboards continuously monitor peg stability across multiple exchanges and protocols.
When deviations appear, alerts notify managers immediately. By linking peg data with whale and TVL analytics, dashboards provide context, showing whether instability stems from temporary trading flows or deeper liquidity stress.
Liquidity Stress Testing Integration
Risk dashboards increasingly integrate stress testing modules. These allow managers to simulate redemption surges, whale outflows, or cross-chain bottlenecks. By modeling outcomes, institutions prepare contingency plans before crises occur.
This proactive capability mirrors traditional banking stress tests but adapts them to the unique realities of stablecoin markets.
Compliance and Oversight Functions
Regulators expect institutions to demonstrate robust oversight. Risk dashboards generate audit-ready reports, track transactions against sanction lists, and highlight compliance exposures.
This integration ensures that institutions not only manage market risks but also meet legal obligations. For treasuries and funds, compliance has become inseparable from portfolio safety.
The Role of AI in Risk Dashboards
Artificial intelligence transforms dashboards from descriptive to predictive tools. AI models analyze historical patterns, detect anomalies, and forecast vulnerabilities. For example, they may predict liquidity stress by linking whale activity with velocity declines.
Institutions increasingly rely on these predictive signals to adjust exposure ahead of risks.
Institutional Use Cases
Risk dashboards serve multiple functions across the organization:
Portfolio managers use them to balance allocations.
Risk officers rely on them to enforce limits and thresholds.
Compliance teams integrate them into regulatory reporting.
Executives and boards review dashboards to assess systemic resilience.
This multi-layered usage highlights why dashboards are central to institutional adoption.
Outlook for 2025
In 2025, institutional risk dashboards are evolving into holistic operating systems. They unify liquidity analytics, compliance, stress testing, and predictive modeling into a single interface.
For institutions, dashboards mean more than efficiency. They mean confidence the ability to deploy billions in stablecoins without fear of blind spots.
Stablecoins are here to stay, but their safety depends on oversight. Risk dashboards ensure that oversight is clear, comprehensive, and continuous.