Total Value Locked (TVL) dashboards are now indispensable for institutions measuring the health and trustworthiness of stablecoin ecosystems.
Why TVL Dashboards Matter
Stablecoins serve as anchors for DeFi protocols, and their strength is often measured by how much liquidity they support. Total Value Locked, or TVL, reflects the capital deposited into lending markets, automated market makers, and collateralized systems. For institutions, TVL is more than a number. It is a measure of trust.
Dashboards that track TVL provide a transparent window into where stablecoins are deployed, which protocols attract confidence, and how resilient the system remains under stress.
The Anatomy of TVL Metrics
TVL is not simply the sum of deposits. It includes collateral locked in lending markets, liquidity in trading pools, and assets staked in governance contracts. Dashboards break these down, showing which stablecoins dominate in each category.
This level of detail allows institutions to evaluate risks and opportunities. A token with high TVL in diverse protocols suggests broad confidence. A token concentrated in one platform signals vulnerability.
Ethereum as the Benchmark
Ethereum continues to set the benchmark for TVL. Its established DeFi protocols attract billions in stablecoin deposits. Dashboards highlight deep pools and steady growth, making Ethereum the preferred choice for long-term institutional capital.
Yet the rise of alternatives is clear. Solana, BSC, and Layer-2 networks now appear prominently in TVL dashboards, reflecting the shift toward multi-chain liquidity.
How Institutions Use TVL Data
Institutions apply TVL dashboards to multiple strategies:
Risk assessment by monitoring whether stablecoin liquidity is growing or contracting.
Allocation decisions by identifying protocols with rising inflows.
Stress testing by tracking withdrawals during volatile markets.
TVL data transforms opaque DeFi markets into measurable liquidity environments.
The Role of Whale Flows in TVL
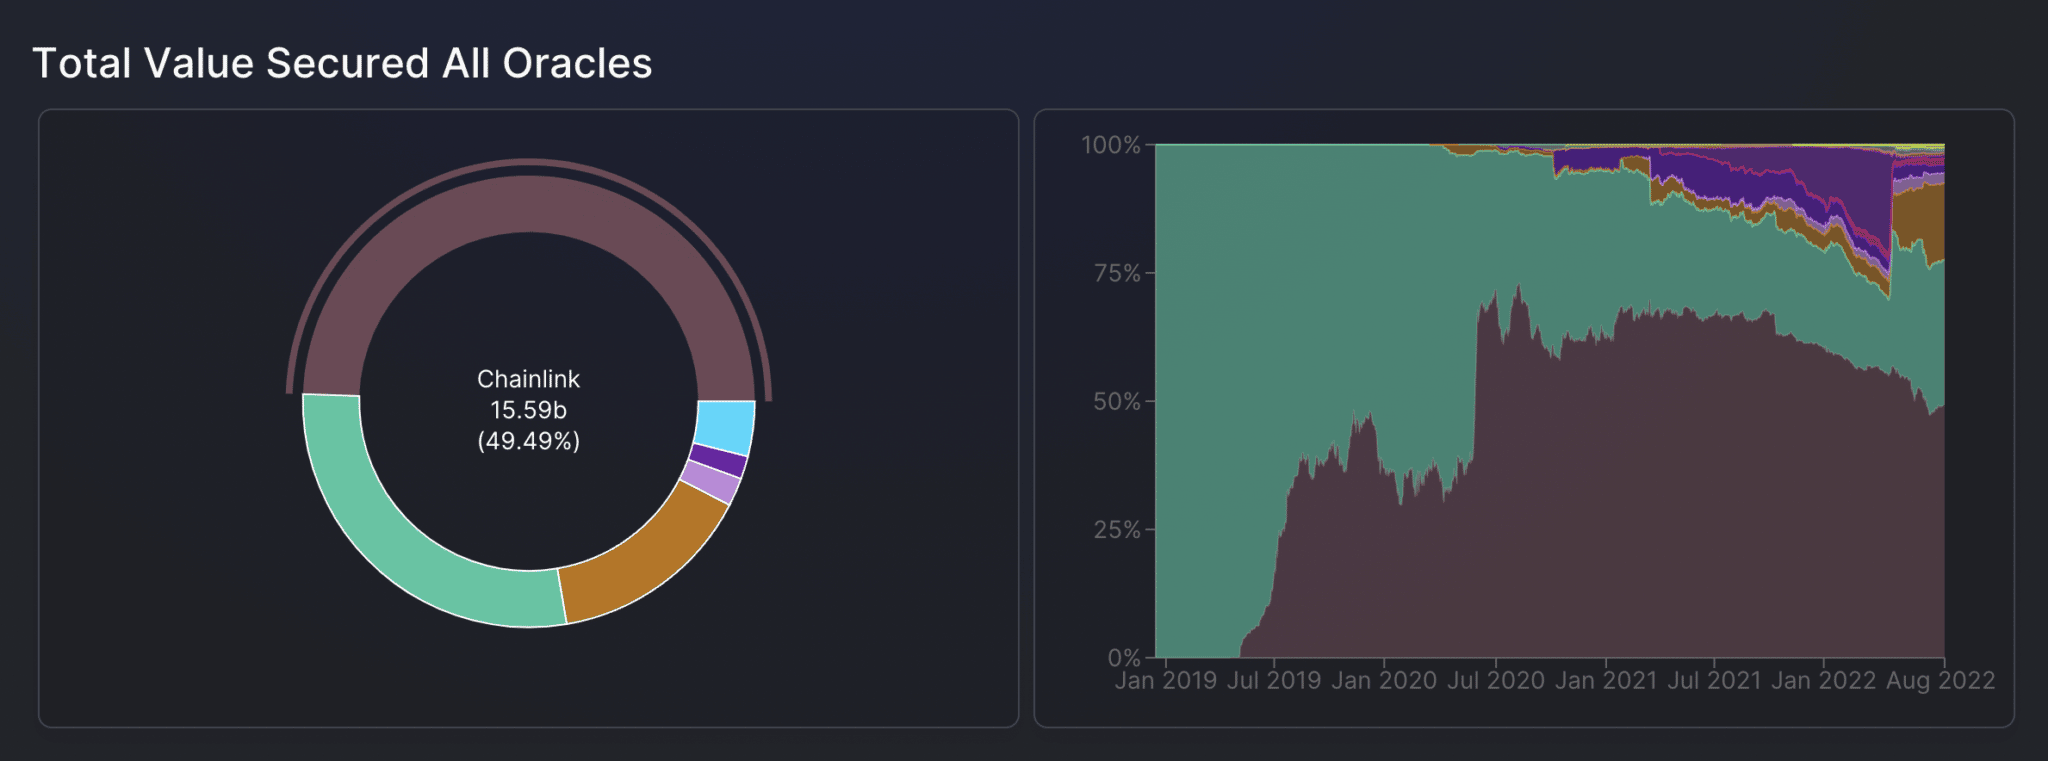
Large inflows and outflows by whales directly impact TVL rankings. Dashboards capture these movements, helping institutions interpret whether rising TVL reflects organic growth or concentrated whale behavior.
By combining TVL metrics with whale analytics, institutions gain a clearer view of liquidity health.
Outlook for TVL Dashboards
In 2025, TVL dashboards are evolving into real-time platforms that integrate cross-chain data and AI-driven alerts. They no longer just measure liquidity. They explain it.
For institutions, TVL dashboards provide both confidence and caution. They reveal where trust is building and where vulnerabilities may lie. In a market defined by stability, TVL remains the ultimate measure of credibility.